In the competitive world of short-term rentals, performance tracking is key to maximizing revenue and staying ahead. Here are the 7 best tools to help property managers analyze key metrics like occupancy rates, ADR (Average Daily Rates), and RevPAR (Revenue per Available Room). These tools also assist with dynamic pricing, market analysis, and benchmarking against competitors.
Quick Overview:
- AirDNA: Global market insights, AI-powered pricing, and competitor analysis.
- PriceLabs: Localized dynamic pricing and custom rules for seasonal trends.
- Transparent: Combines global and local data for pricing optimization.
- Mashvisor: Heatmap visualization for neighborhood profitability.
- Wheelhouse: Advanced AI for real-time rate adjustments.
- Beyond Pricing: Large-scale dynamic pricing with real-time demand tracking.
- StayHub: Dubai-focused analytics and revenue tools.
These platforms turn raw data into actionable insights, helping rental managers optimize pricing, spot trends, and improve operations. Whether you’re managing a single property or a large portfolio, these tools simplify decision-making and boost performance tracking.
Top 10 Vacation rental KPIs That Every Host and Property Manager Should Track
1. AirDNA
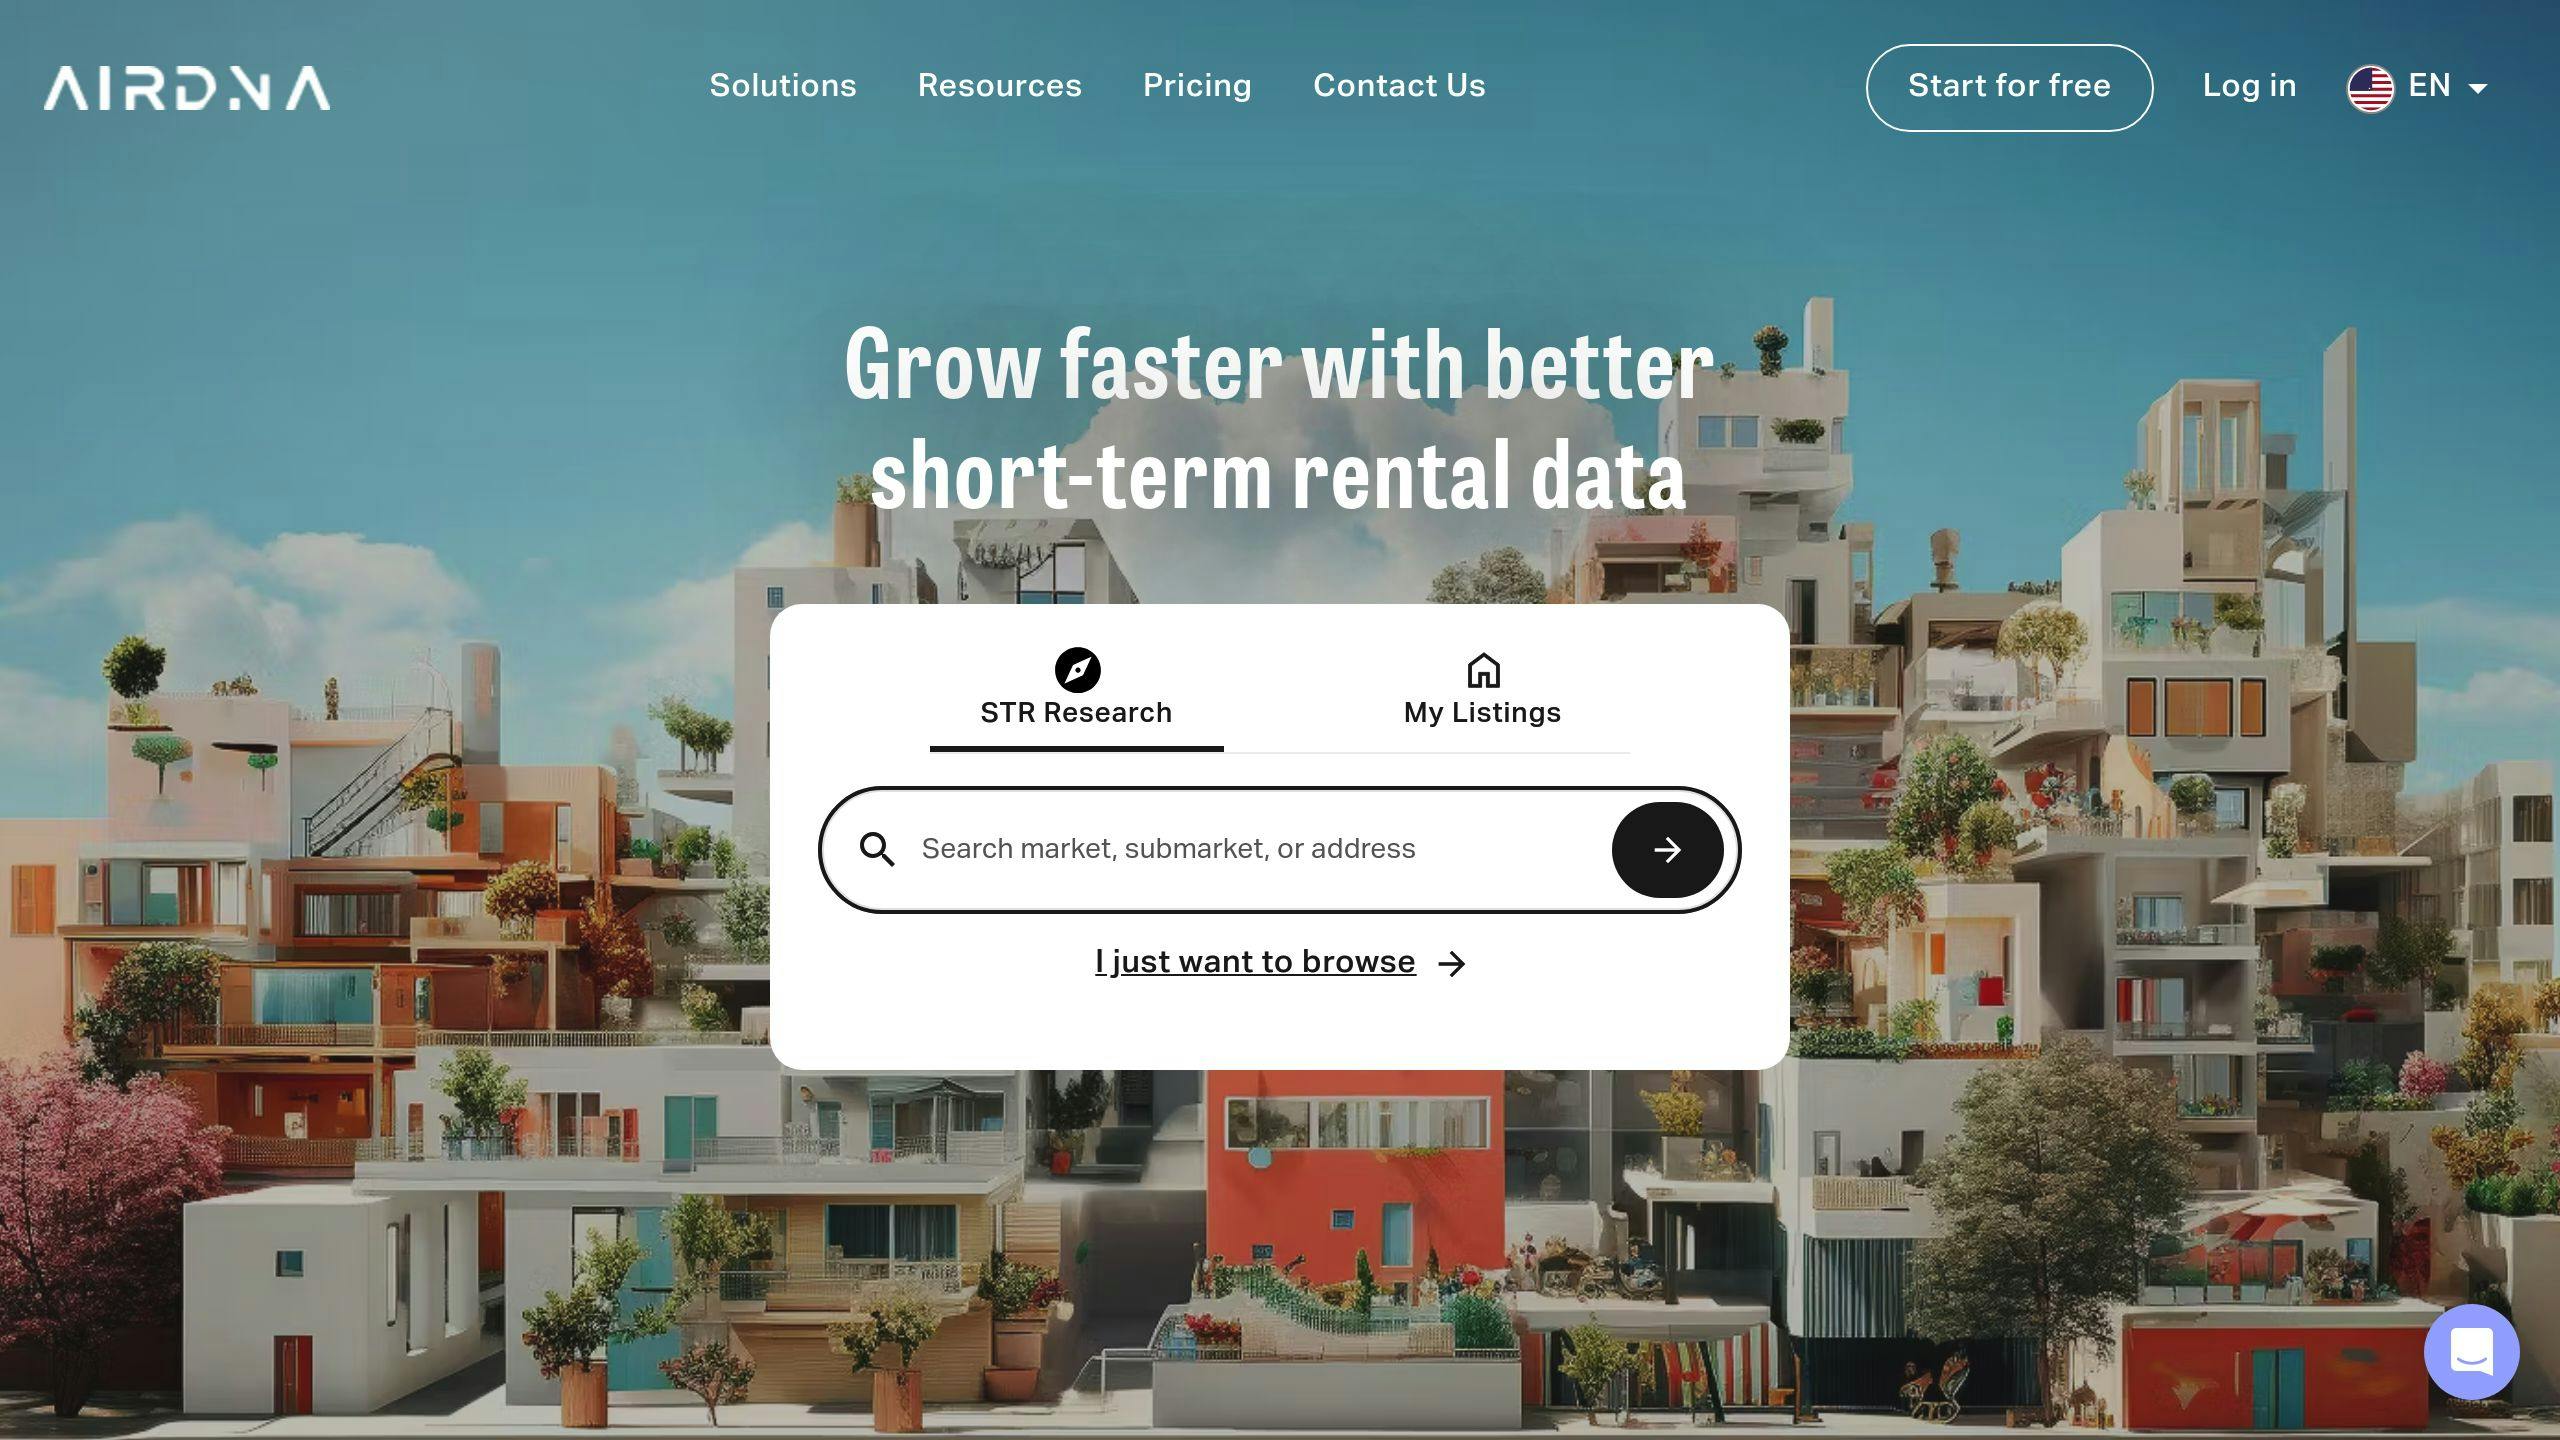
AirDNA is a go-to platform for property managers looking for insights on a global scale. With data from 80,000 cities, it offers real-time market analysis by integrating with Airbnb, VRBO, and Booking.com. Here’s what it brings to the table:
| Feature | What It Offers |
|---|---|
| Market Reports | Insights into occupancy rates, average daily rates (ADRs), and revenue per available room (RevPAR) |
| Dynamic Pricing | Automated pricing based on current market trends |
| Competitor Analysis | Compare your property’s performance with similar listings |
| Revenue Management | Tools to refine pricing and manage availability effectively |
One standout feature is the platform’s AI-powered pricing tool. It evaluates market trends and suggests pricing adjustments, helping properties boost revenue by an average of 22% compared to those without it [1].
AirDNA’s dataset includes 10 million listings across the globe, giving users access to valuable comparison points for better decision-making [1].
Subscription plans range from $19/month for basic analytics to $99/month for advanced enterprise tools [1]. With easy-to-follow tutorials, AirDNA is useful for both beginners and seasoned professionals in the short-term rental industry.
2. PriceLabs
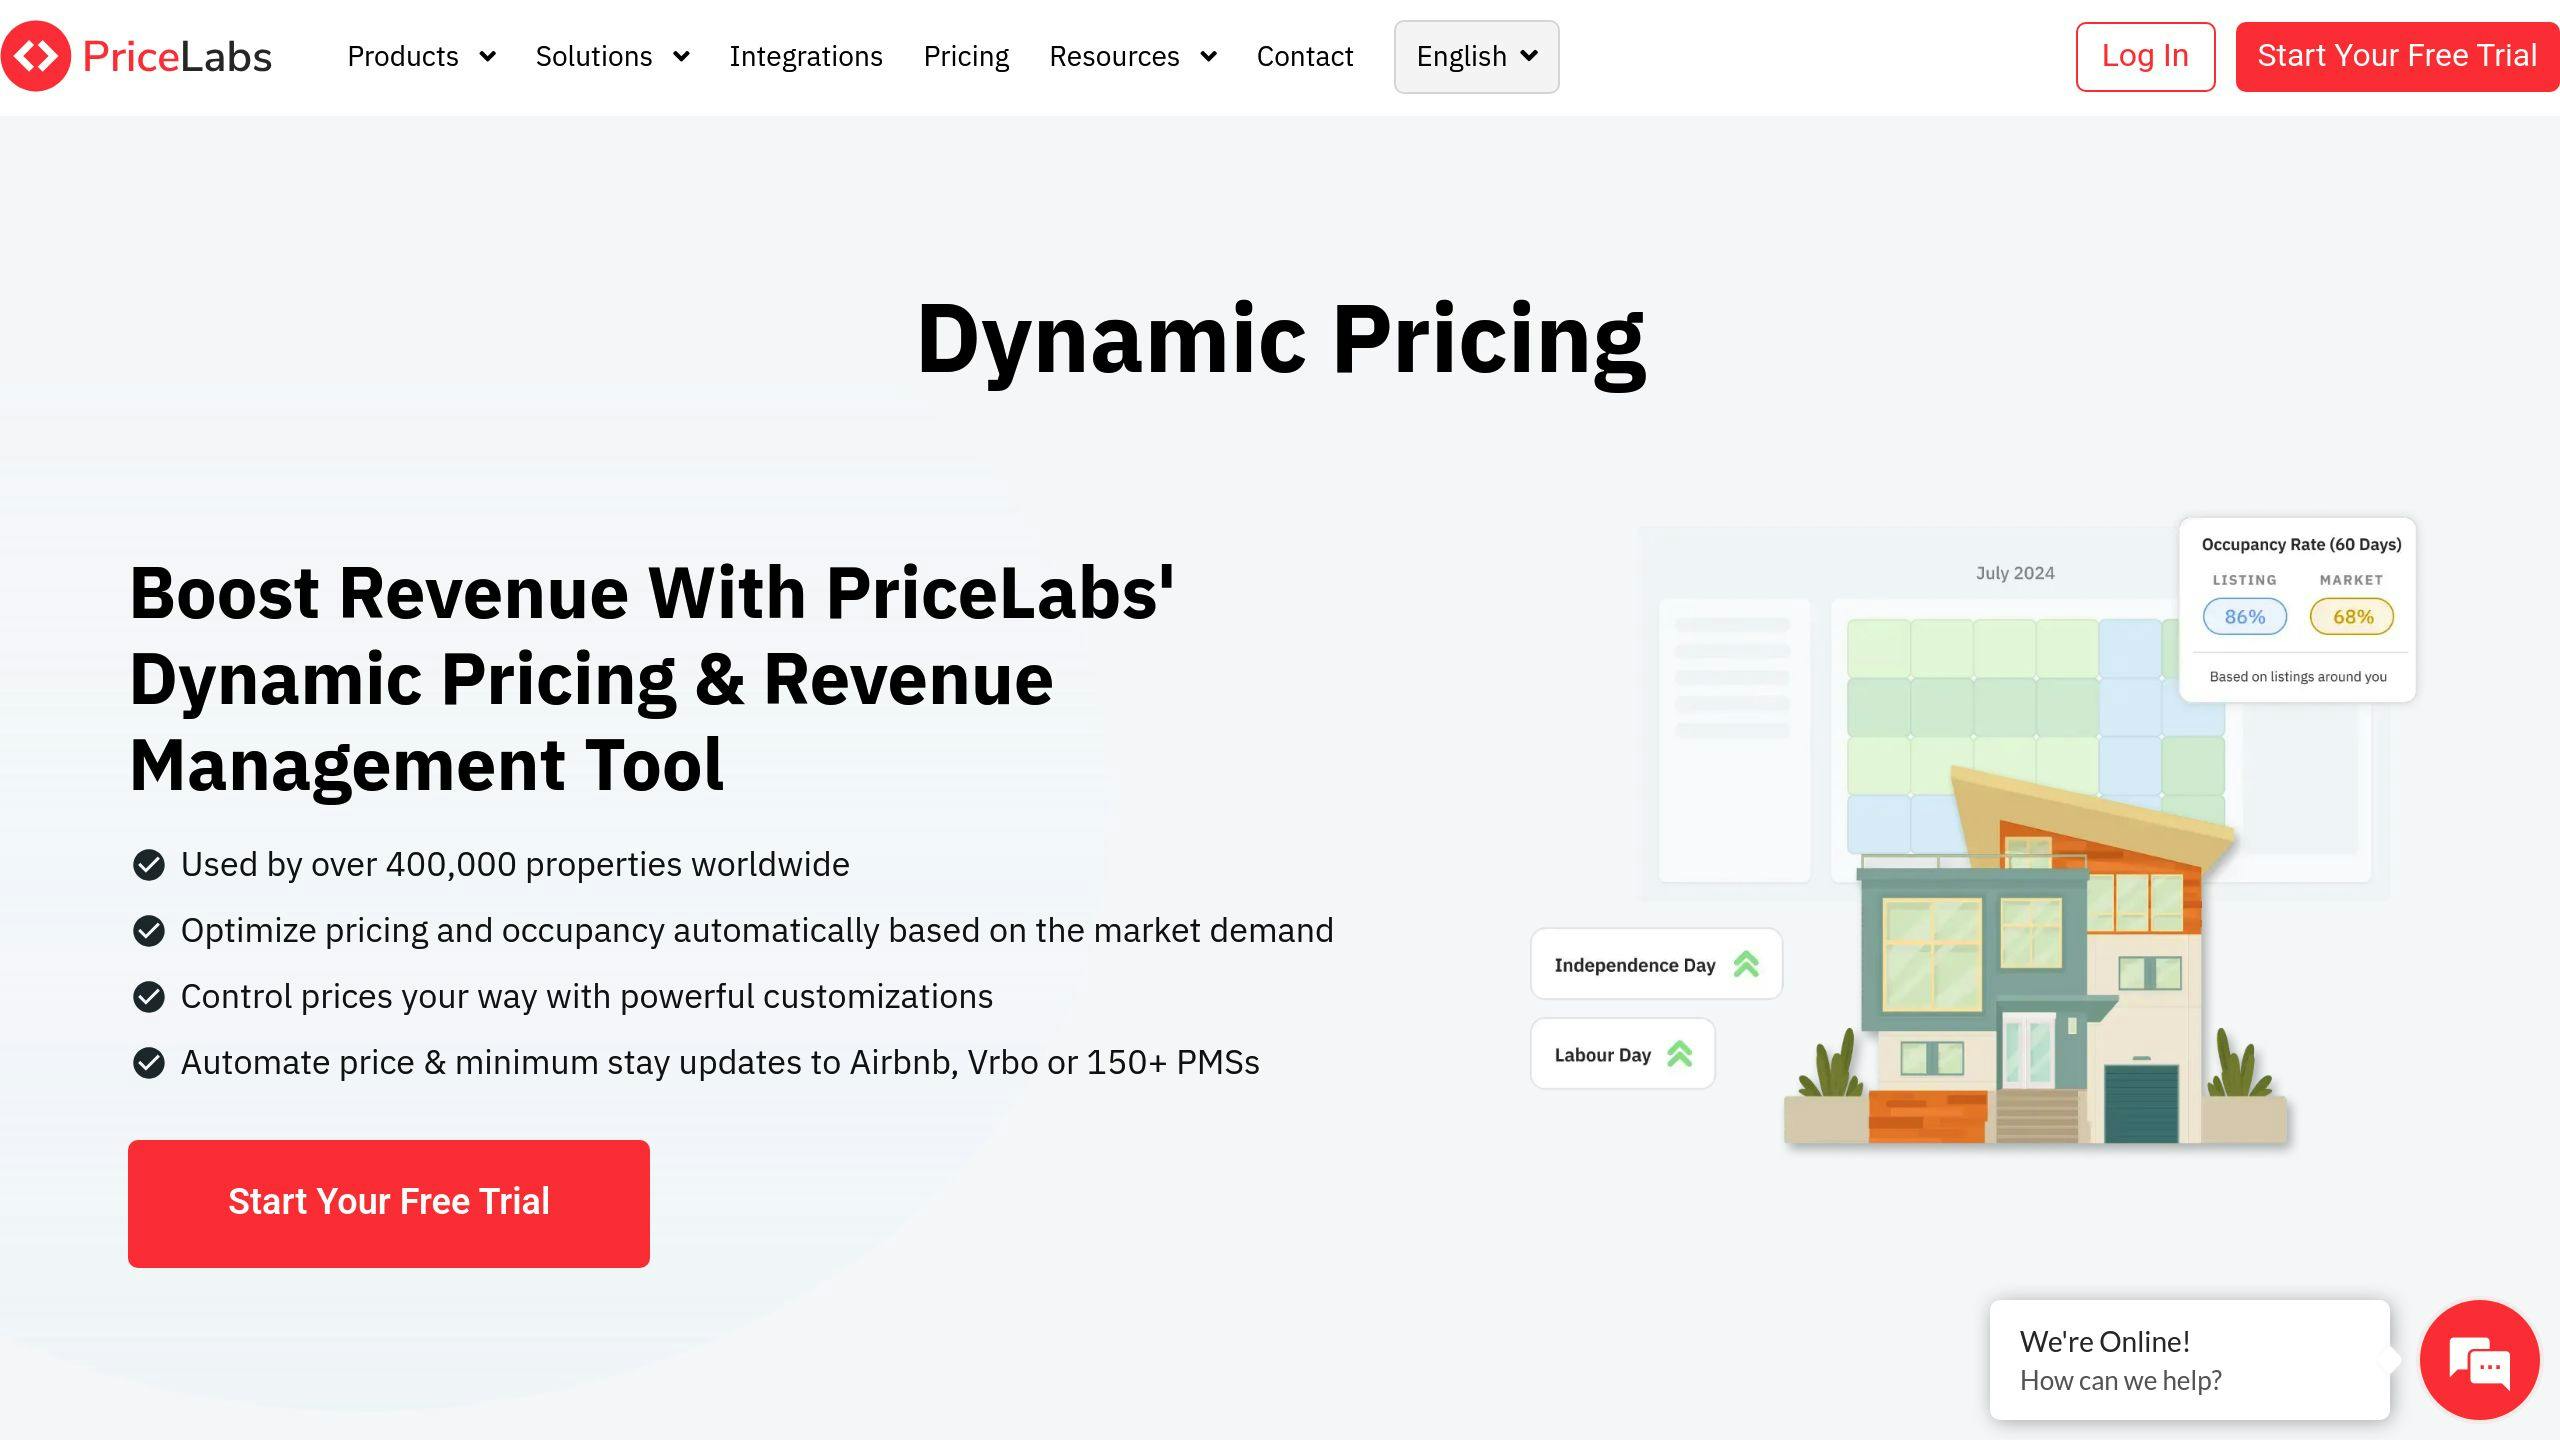
PriceLabs processes an impressive 10 million rate adjustments every day [2]. While AirDNA focuses on broad market trends, PriceLabs hones in on fine-tuned, localized rate adjustments using machine learning.
| Feature | Description |
|---|---|
| Market Analytics | Compares property performance with nearby competitors |
| Dynamic Pricing | Tailored strategies to optimize rates |
| Platform Integration | Connects directly with Airbnb, VRBO, and Booking.com |
| Custom Rules | Allows flexible pricing for seasons and special events |
PriceLabs uses a performance-based pricing model, charging just 1% of your monthly revenue. This makes it a practical choice for property managers, regardless of portfolio size [3].
What makes PriceLabs stand out is its ability to analyze local markets deeply. It adjusts rates automatically by factoring in things like seasonal trends, local happenings, and past booking data.
For those who want more control, the platform offers custom pricing rules, letting managers tweak strategies to fit specific market dynamics.
3. Transparent
Transparent takes PriceLabs’ localized strategy and applies it on a global scale, managing data from over 35 million listings across 65,000 cities. While it shares PriceLabs’ focus on localized insights, Transparent stands out by catering to global markets [1]. Its dynamic pricing engine can help increase revenue by up to 20%, thanks to algorithms that assess historical occupancy, seasonal patterns, and real-time demand [2].
| Feature | Details |
|---|---|
| Market Analytics | Offers real-time competitor analysis and tracks local market trends |
| Dynamic Pricing | Automatically adjusts rates based on a variety of data points |
| Platform Integration | Connects directly with Airbnb, VRBO, and Booking.com |
| Revenue Management | Provides tools for tracking and optimizing property performance |
By leveraging AirDNA’s extensive global dataset, Transparent’s pricing tools focus on hyperlocal adjustments while complementing broader market analysis. This multi-layered approach ensures properties perform at their best.
Transparent also integrates effortlessly with major booking platforms, putting key metrics like occupancy rates and guest satisfaction trends in one place. What’s more, its pricing plans are designed to fit different business needs, offering a tailored solution for property managers.
4. Mashvisor
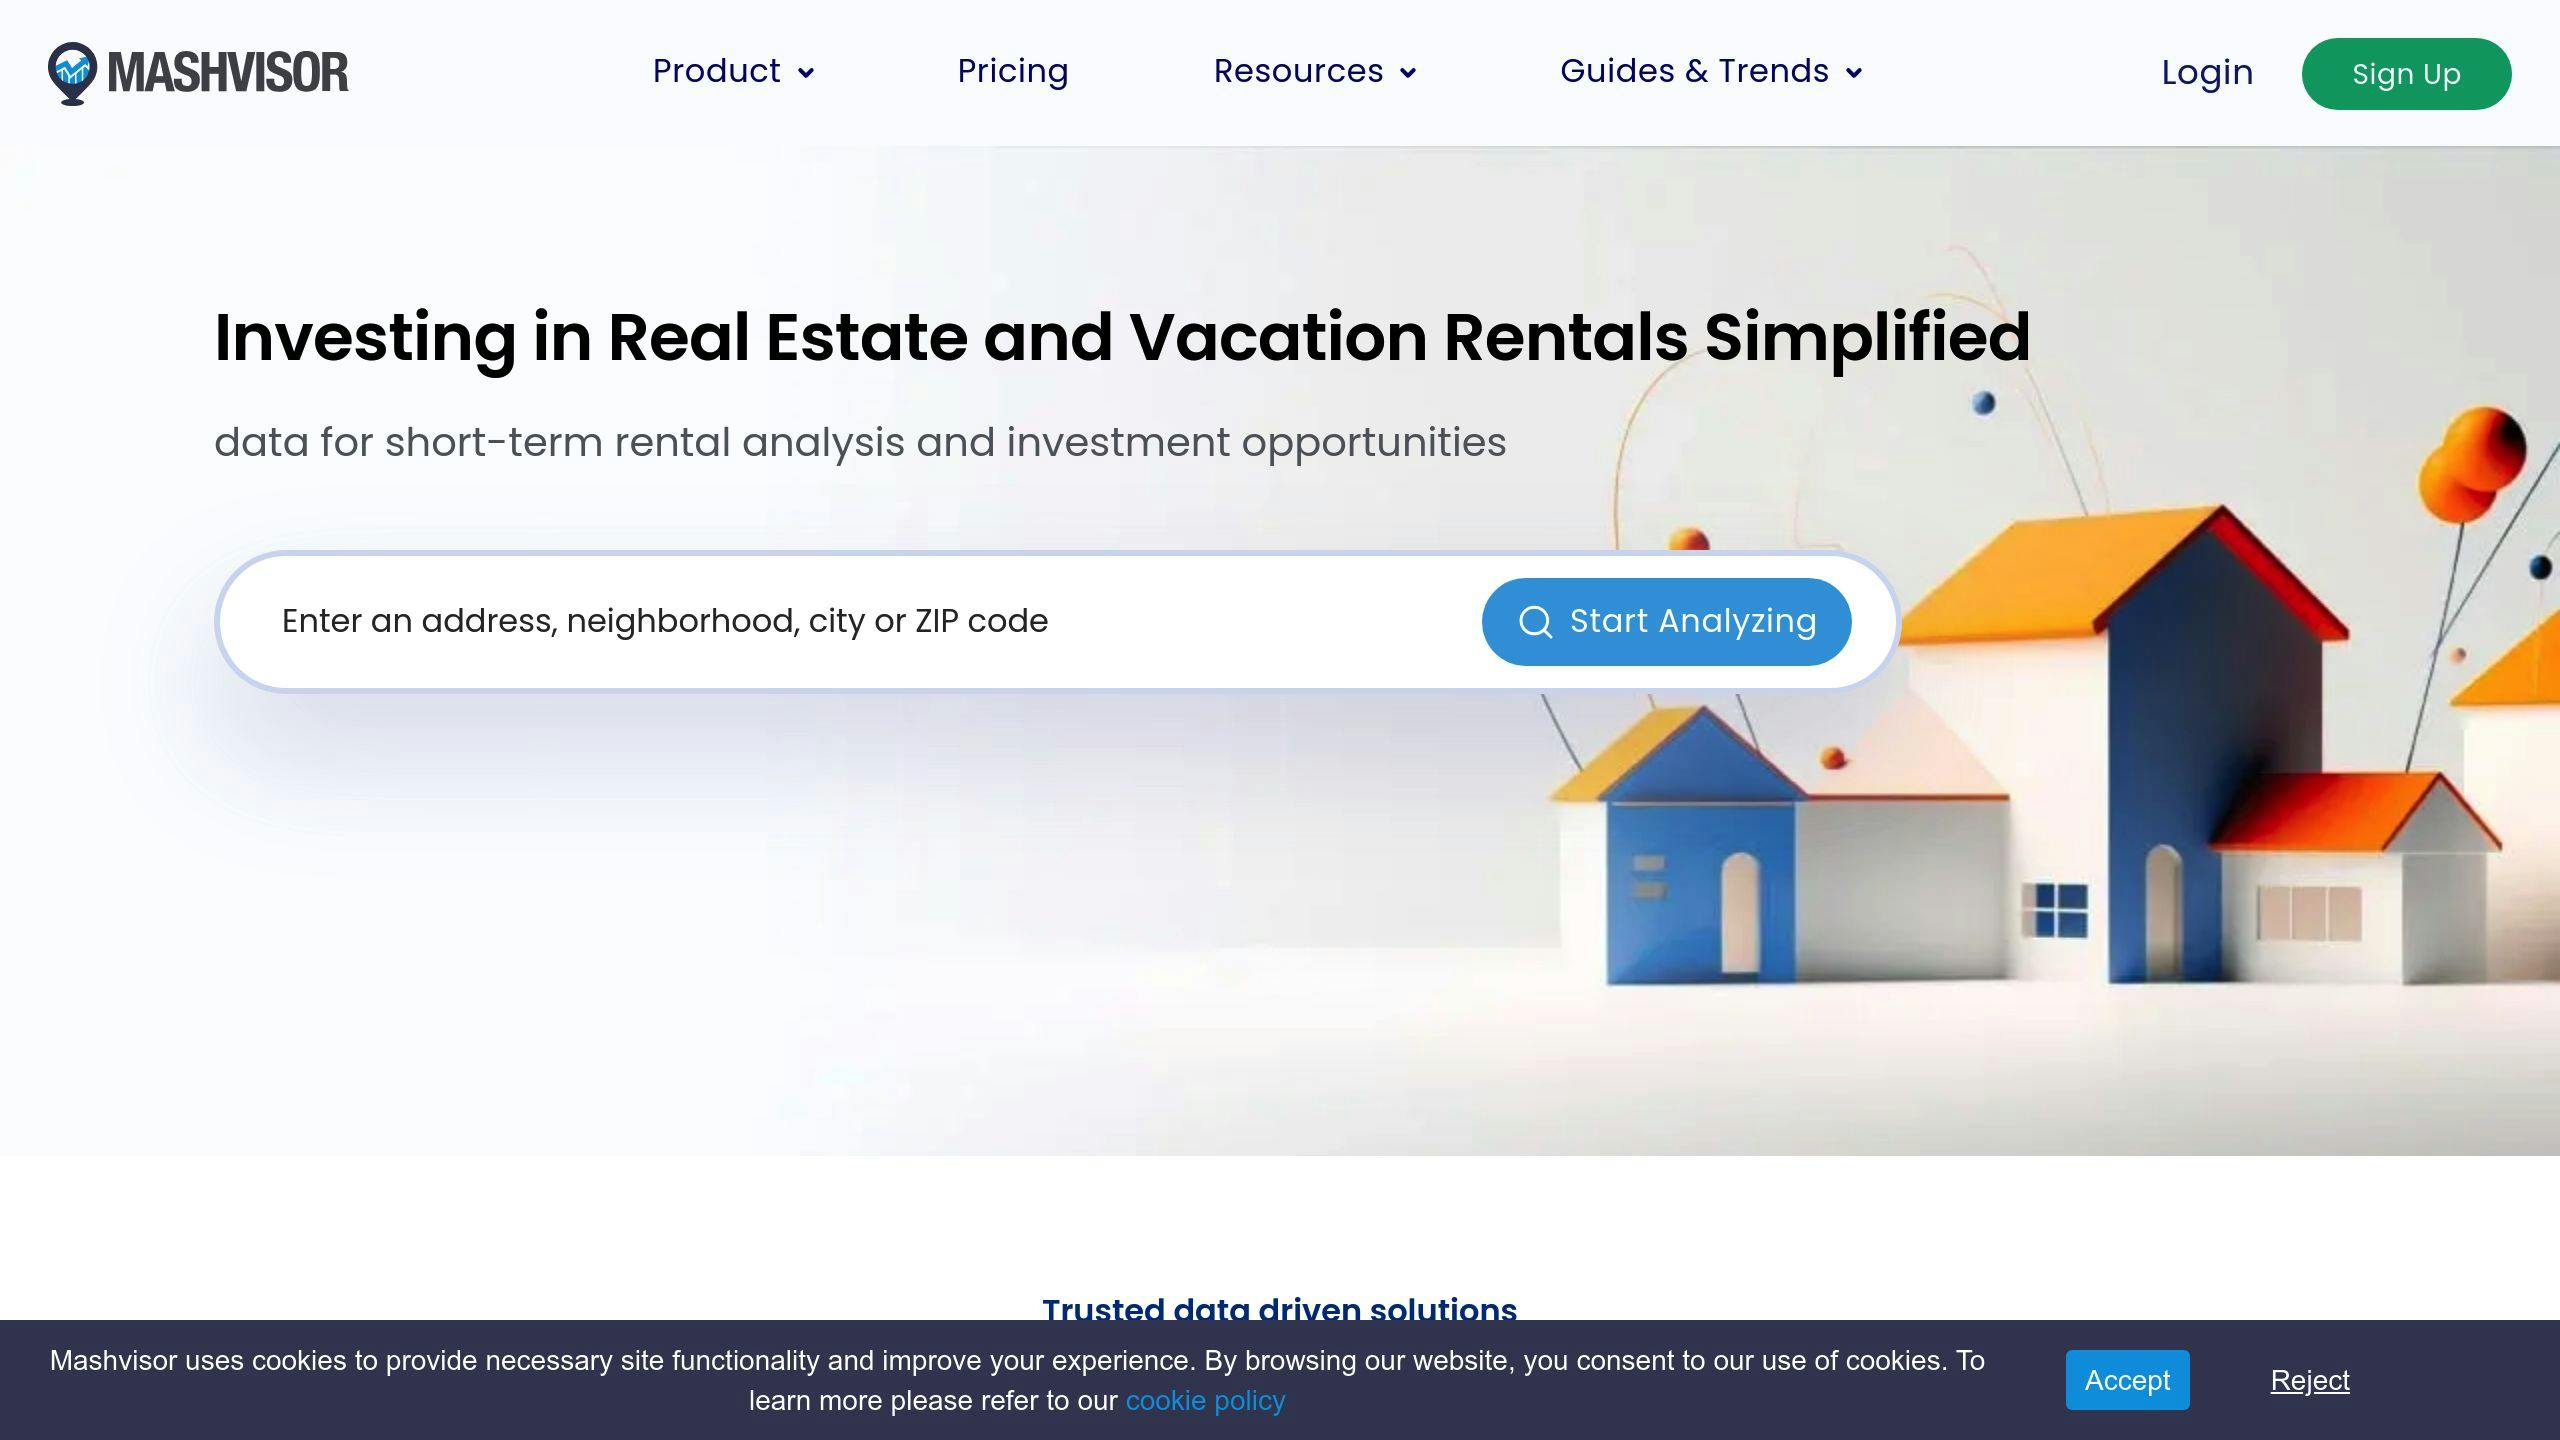
Mashvisor combines machine learning with heatmap visualization to help users pinpoint profitable neighborhoods. Its color-coded demand analysis provides neighborhood-level insights, using AirDNA’s global dataset as a foundation. This visual tool works well alongside Wheelhouse’s neighborhood-focused strategy (discussed later) and includes predictive analytics for added value.
Similar to PriceLabs’ localized pricing adjustments, Mashvisor uses AI-driven pricing to boost property performance. According to the platform, its system can increase revenue by up to 25%.
| Feature | Description |
|---|---|
| Market Analytics | Offers profitability data at the neighborhood level |
| Dynamic Pricing Engine | AI-based pricing adjustments for better revenue potential |
| Performance Dashboard | Tracks KPIs and benchmarks competitors |
Pricing starts at $49.99/month, with advanced features available in plans up to $99.99/month. Mashvisor enjoys a solid reputation, highlighted by its 4.5/5 Trustpilot rating from over 1,000 reviews.
Users often highlight the platform’s unified dashboard, which allows them to monitor KPIs across multiple platforms in one place. This setup simplifies operations and helps uncover trends that might otherwise go unnoticed.
sbb-itb-9849306
5. Wheelhouse
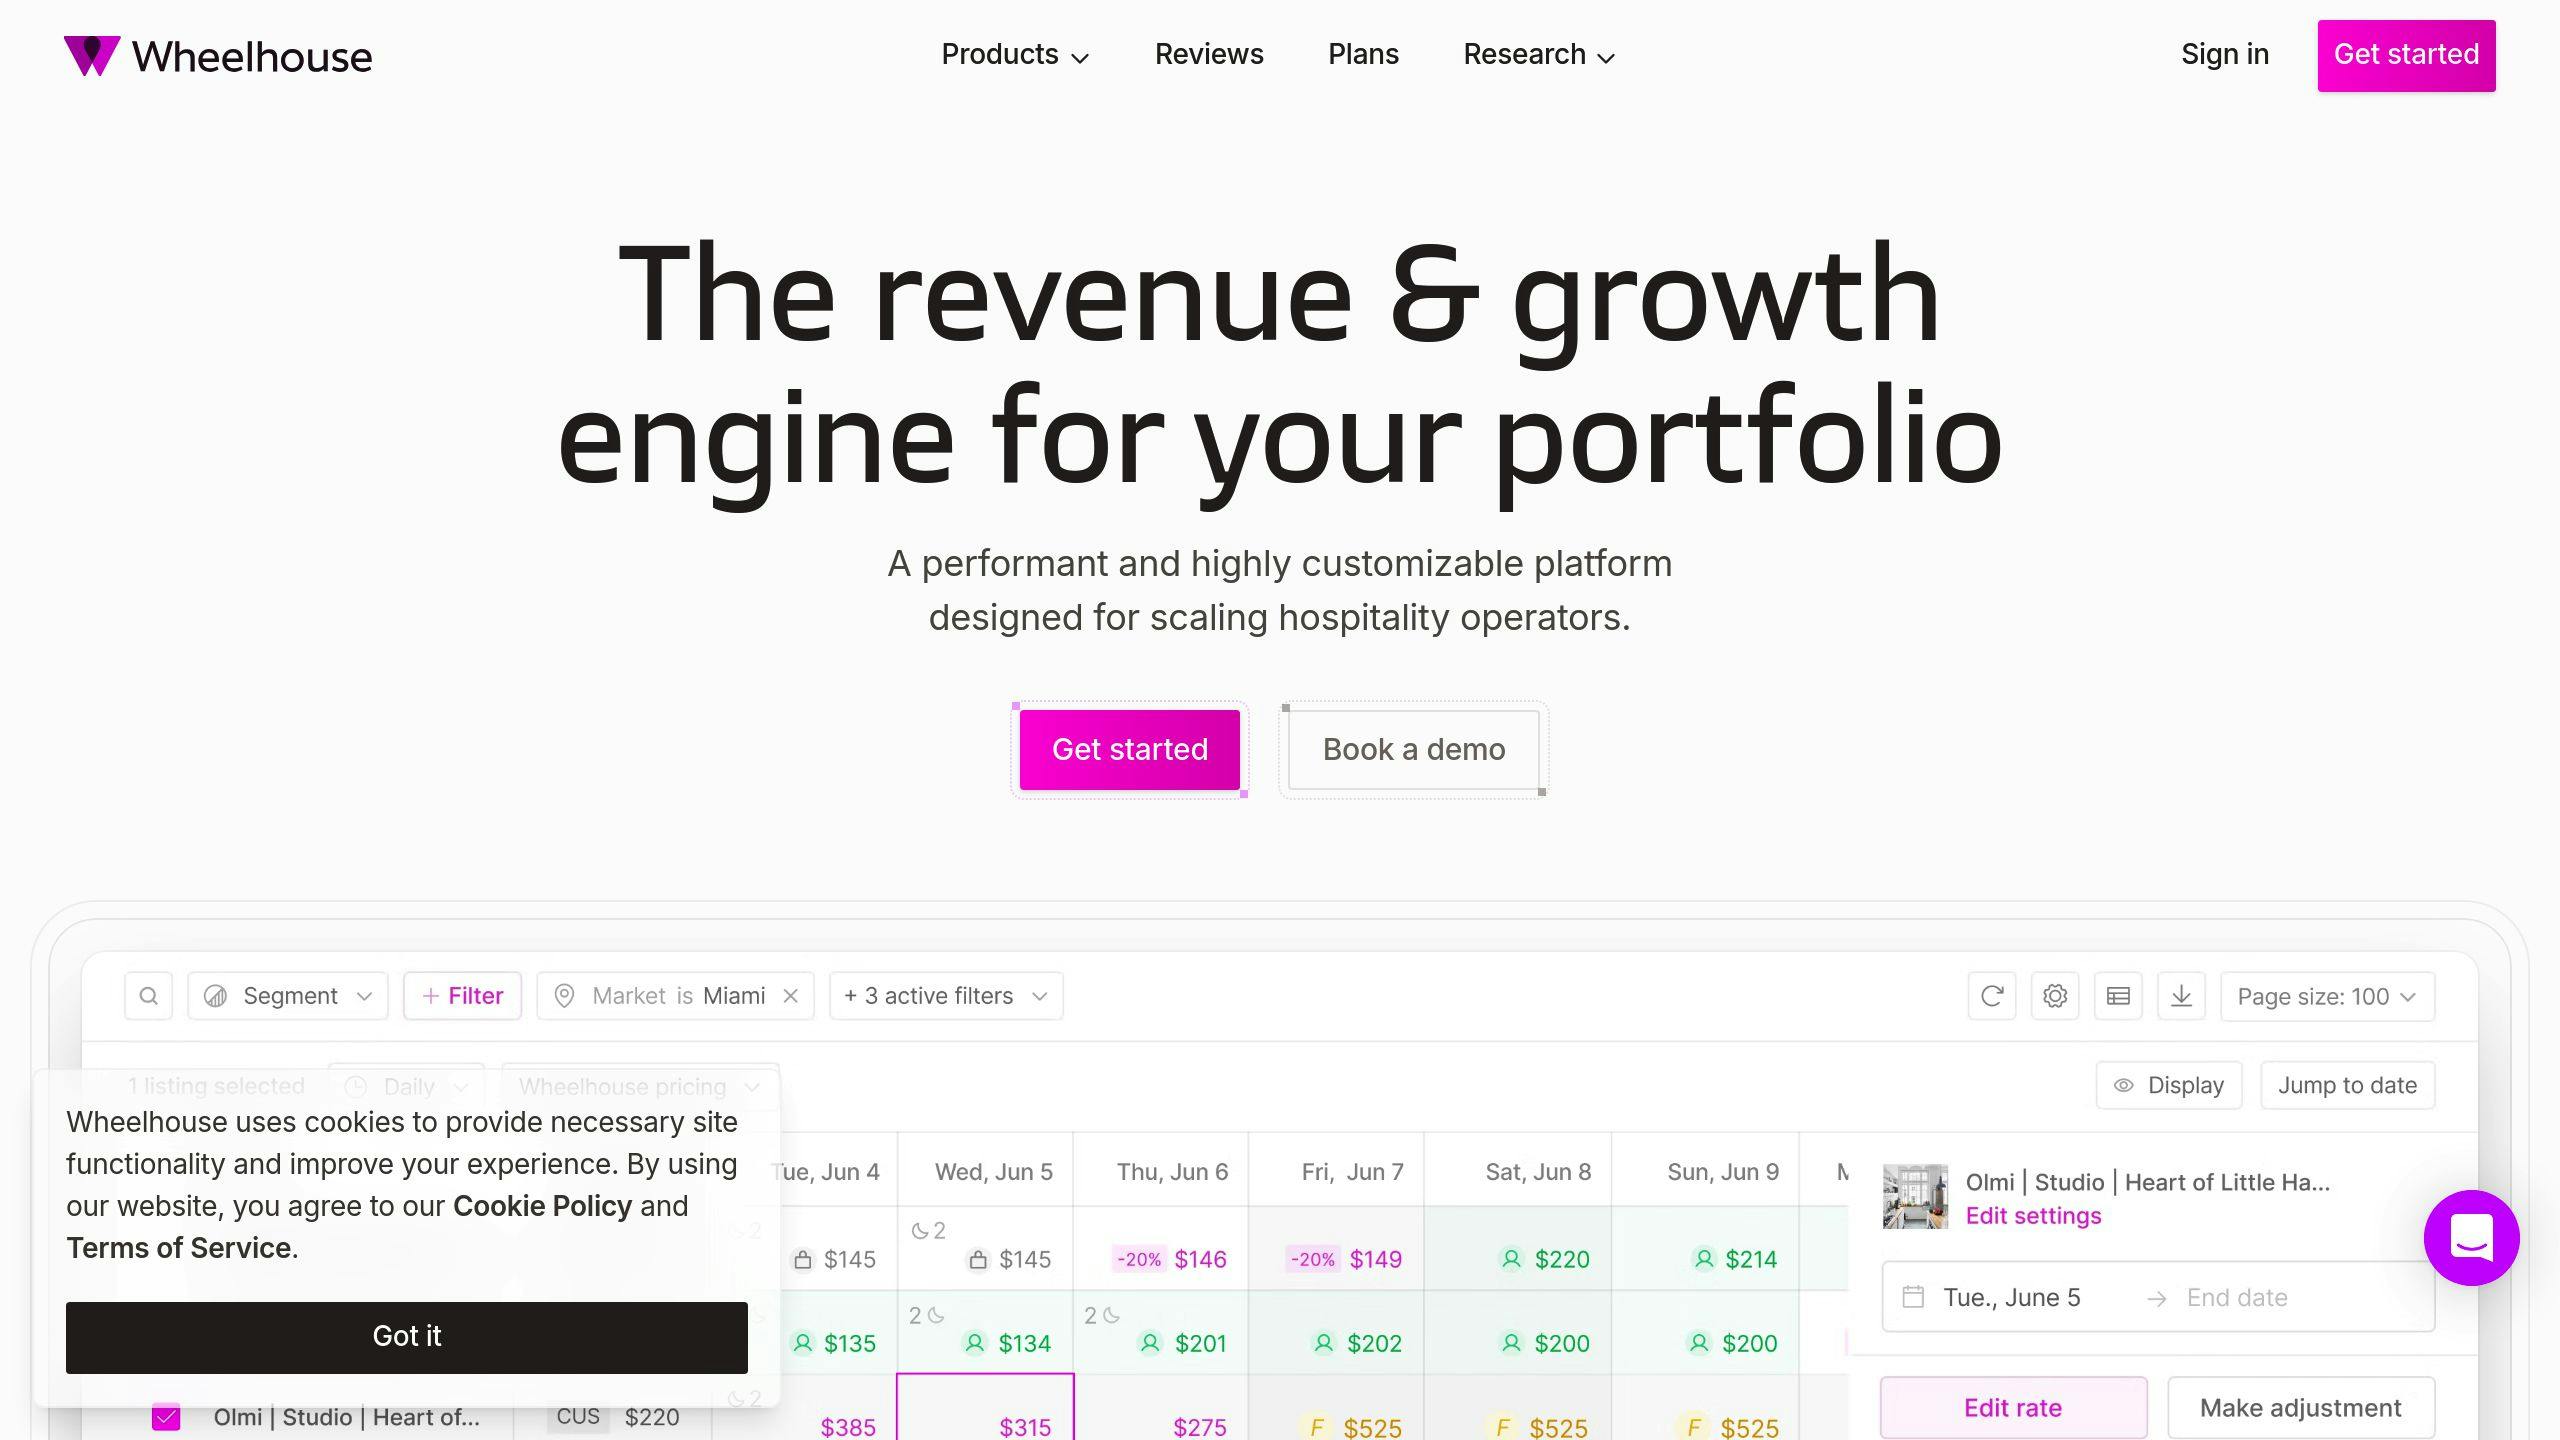
While Mashvisor helps pinpoint profitable neighborhoods, Wheelhouse takes it further with advanced dynamic pricing. It processes over 1 million daily rate changes, using AI to analyze factors like local events, seasonal shifts, and competitor activity. This approach can increase revenue by up to 20%, honing in on neighborhood-level specifics much like Transparent’s broader global focus.
| Feature | What It Does |
|---|---|
| Market Analytics | Provides real-time competitor tracking and demand predictions |
| Dynamic Pricing | Adjusts prices automatically based on market trends |
| Platform Integration | Connects directly with Airbnb, VRBO, and Booking.com |
| Revenue Management | Allows custom pricing rules and sets minimum stay requirements |
Wheelhouse caters to properties of all sizes with flexible pricing plans. Its dashboard, similar to Mashvisor’s, delivers detailed insights into market trends, occupancy rates, and RevPAR (Revenue Per Available Room). Plus, its seamless integration with major booking platforms – like Airbnb and VRBO – removes the hassle of manual updates, echoing AirDNA’s multi-platform compatibility.
Property managers value Wheelhouse for its ability to anticipate demand spikes and adjust pricing strategies accordingly. By combining its dynamic pricing engine with market intelligence tools, the platform provides a comprehensive solution for maximizing revenue.
6. Beyond Pricing
Beyond Pricing takes a broader approach compared to Wheelhouse, handling over 100 million pricing updates daily. Its AI-powered algorithms fine-tune prices based on real-time market trends, competitor activity, and seasonal shifts. This helps users potentially boost revenue by 10-20%, building on the localized methods seen in platforms like Wheelhouse and Transparent.
| Feature | Capability |
|---|---|
| Market Intelligence | Tracks competitors and forecasts demand in real-time |
| Revenue Optimization | Offers automated pricing with customizable rules |
| Platform Coverage | Integrates directly with Airbnb, VRBO, and Booking.com |
| Performance Metrics | Monitors occupancy rates, ADR, and RevPAR |
“Dynamic pricing is not just about raising prices during peak seasons but also about lowering them during off-peak seasons to maximize occupancy.” – David Kelso, CEO of Beyond Pricing
The platform’s dashboard provides a centralized view of key metrics like occupancy, ADR, and RevPAR, while also factoring in the effects of local events. What makes Beyond Pricing stand out is its ability to combine the neighborhood-level insights of Wheelhouse with Transparent’s global reach. This makes it ideal for managers who need large-scale solutions without losing local accuracy.
With direct PMS integrations, Beyond Pricing automates adjustments seamlessly. Its algorithms continuously analyze market conditions, tweaking prices to balance occupancy and revenue effectively.
7. StayHub

StayHub is tailored for businesses operating in Dubai, offering a suite of analytics and revenue management tools designed specifically for this market. Unlike platforms with a global focus, StayHub zeroes in on Dubai, delivering insights that are highly relevant to the region through its unified dashboard.
Its analytics engine provides real-time data on key performance metrics:
| Metric Type | Tracking Capabilities |
|---|---|
| Market Analysis | Local demand patterns, competitor pricing, seasonal trends |
| Financial Performance | ADR, RevPAR, occupancy rates, revenue forecasting |
| Booking Patterns | Lead times, length of stay, guest preferences |
| Revenue Optimization | Dynamic pricing adjustments, yield management |
Users have reported achieving ADRs that are 77% higher than the market average. StayHub’s revenue management service (RMS) automatically tracks market conditions and adjusts rates and occupancy levels accordingly. Its customizable dashboards allow property managers to closely monitor performance, making it a go-to tool for those managing properties in Dubai.
Conclusion
From AirDNA’s worldwide analytics to StayHub’s Dubai-centered tools, picking the right platform depends on matching its features with your business size and market focus. The seven tools discussed earlier highlight how critical data-driven decisions are for boosting returns.
| Performance Area | Impact |
|---|---|
| Market Intelligence | Better tracking of market positioning |
| Revenue Optimization | Adjusting pricing dynamically based on market trends |
| Financial Performance | Improved monitoring of KPIs like ADR, RevPAR, and occupancy rates |
These tools do more than just track – they streamline processes and improve outcomes. Whether you choose global platforms like AirDNA and Transparent or region-specific options like StayHub, your decision should align with your portfolio’s geographic priorities. Automation plays a big role in cutting down manual tasks while enhancing results.
When evaluating these tools, focus on:
- Integration with existing systems to ensure smooth operations
- Depth of data analysis and the quality of reporting features
- Insights tailored to your market for relevant decision-making
- Scalability to support your business as it grows
A great tool doesn’t just monitor – it helps you improve performance with actionable insights and automated features.
FAQs
How does Airbnb measure performance?
Airbnb uses specific metrics to evaluate how properties perform, focusing on two main areas:
Occupancy & Rates Metrics:
- Tracking occupancy rates
- Monitoring cancellation rates
- Analyzing the average length of stay
- Assessing nightly rate trends
These metrics provide key insights into property performance. For deeper market analysis, you can pair them with third-party tools, like the ones mentioned earlier.
Quality Assessment: Guest reviews play a big role in assessing property quality. Airbnb evaluates reviews based on these seven categories:
| Review Category | Focus Area |
|---|---|
| Accuracy | How well the listing matches the actual property |
| Amenities | Availability and condition of listed features |
| Check-in | Ease and smoothness of the arrival process |
| Communication | Host’s responsiveness and clarity |
| Cleanliness | Hygiene and upkeep of the property |
| Location | Accuracy of location details and accessibility |
| Value | Guest perception of worth compared to price |
Related Blog Posts
- 7 Essential Property Management Tools for Dubai Rentals
- Best Reporting Tools for Dubai Property Managers 2025


